This installment was originally posted on the Farm to Institution New England (FINE) blog.

INSTALLMENT NO. 3 OF 6
Schools, institutions of higher education and hospitals in New England spend hundreds of millions of dollars on food and beverages annually. Institutions have the potential to significantly impact regional economies and communities by using their tremendous purchasing power to invest in local food. These transactions are affected, however, by a number of factors including budgets, operational characteristics (like whether an institution operates its own dining services or is managed by a food service management company), contract terms with prime vendors and other issues that stakeholders cite across the supply chain. Understanding the system in which these institutions already exist is an important part of working with them.
Sources
FINE uses both primary and secondary data for our metrics work. This series will pull from a variety of sources, however the majority of our data on K-12 schools, colleges and universities and hospitals come from the following surveys:
- 2015 FINE College Dining Survey (reflects their last fiscal year)
(N=105/209; 50% response rate) - 2015 USDA Farm to School Census (reflects 2013-14 school year)
(N=727/1015 New England school districts; 72% response) [1] - 2017 Health Care Without Harm Healthy Food in Health Care Survey (reflects 2016 spending)
(N=54/150; 36% response rate with some data extrapolated to the the subset [150/256] of hospitals that are part of the Health Care Without Harm Network)
The information shared through this blog reflects the respondents who voluntarily participated, and not the entire New England population; survey and census data are self-reported and may conflict with other data sources.
Institutional Food Budgets
Results from United States Department of Agriculture’s Farm to School Census, Health Care Without Harm’s Healthy Food in Health Care Survey [2], and Farm to Institution New England’s Farm to College Dining Survey show that respondents across the three sectors spent an aggregated $731+ million on food and beverages in their last fiscal year. Because this number represents only a portion of the institutional population, it very likely underestimates the full amount of dollars being spent on food and beverages by institutions in the region. These budgets vary across and within institutional sector. The average annual food budget for individual K-12 respondents in New England was $402,000. For health care respondents it was $1.8 million, and responding colleges had an average annual food and beverage budget of $3.8 million. Ranges within each type of institution are also wide; in the college sector alone, the average annual food and beverage budget ranged from $23,000 to $25 million [3].
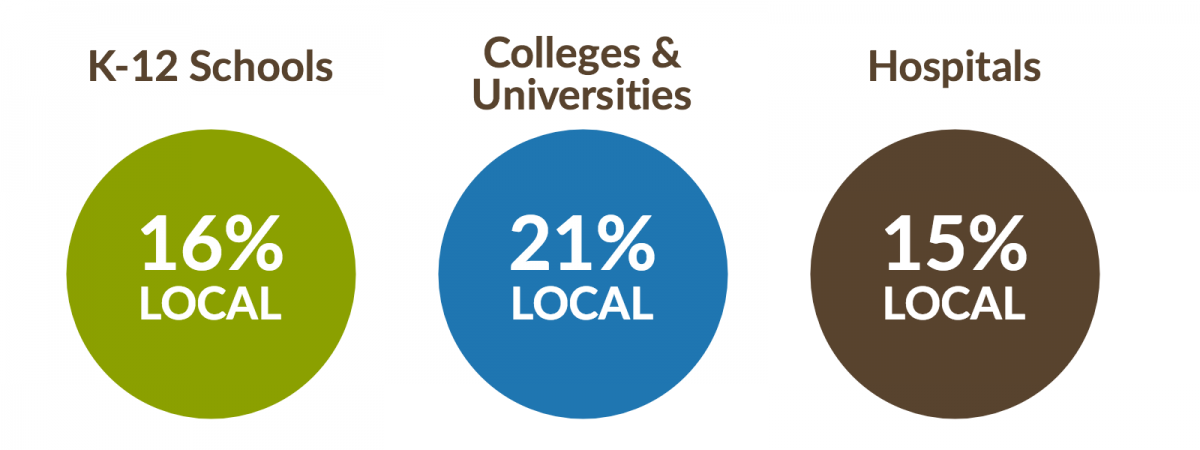
Institutions in New England are spending a significant percentage of their food dollars on local product. Across the three sectors, surveyed institutions reported spending 17 percent of their food budgets on local food and beverage (see Figure 1).

Figure 1: The average percent of total budget spent on local product reported by respondents across the K-12, college, and hospital sectors.
While 17 percent may seem to some like a small portion of an overall institutional food budget, it becomes more impressive when we look at the amount of local product that New Englanders are consuming in total. In their New England Food Vision, Food Solutions New England estimates that approximately 90 percent of the food consumed in New England is produced outside the region. At the state level, a 2014 survey performed by Vermont Farm to Plate and Florence Bécot, MS and Dr. David Conner of the University of Vermont, showed that 6.9 percent of total Vermont food purchases were made locally. In Rhode Island, an estimated one percent of the total food consumed is grown locally, according to the 2017 Rhode Island Food Strategy. As we saw in Installment No. 2, differing definitions of “local” make this measurement somewhat tricky – both of the above-mentioned reports define local as food produced within that particular state, while respondents across our three institutional sectors don’t necessarily use that definition. Regardless, when we look at the percent spent on local product across the board, it’s clear that institutions are leaders.
Of their total food and beverage budgets, respondents across the three sectors spent an aggregated $123 million on local food: approximately $57 million in the college and university sector, $25 million in the K-12 school sector and $42 million in the hospital sector. As with the total reported budgets, these numbers reflect only a portion of the population and likely underestimate the full amount spent on local food by institutions in the region.
Operational Characteristics & Local Procurement
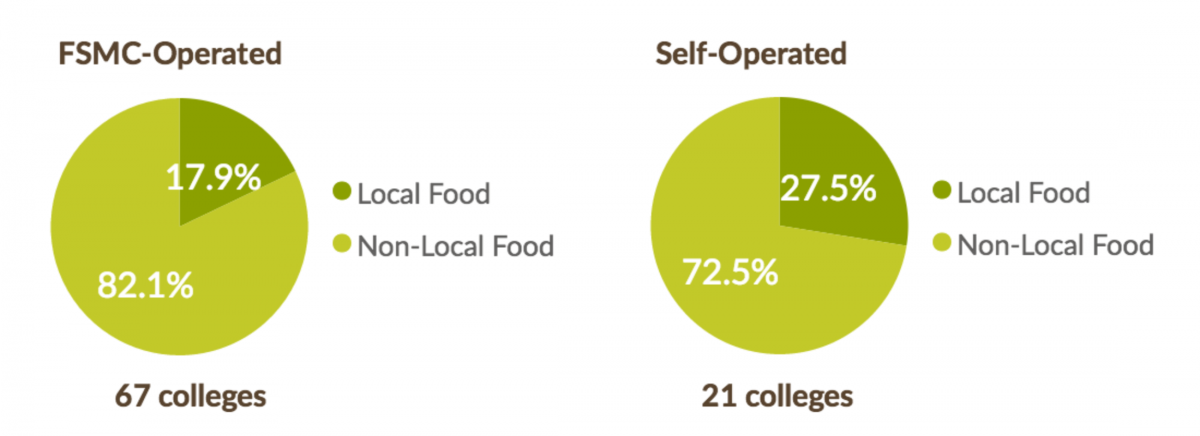
Survey analysis shows a range in the amount of locally procured product based on certain operational characteristics. For example, FINE’s Farm to College Dining Survey revealed a statistical difference in the average percent of total budget spent on local food between campuses that were self-operated and those run by food service management companies (FSMCs): 27.5 percent for self-operated versus 17.9 percent for FSMC-operated (See Figure 2).

Figure 2: Average percent of budget spent on local food by operation. N=88.
Schools that are self-operated are often less restricted by contracting terms and thus have more freedom in their purchasing. Survey results showed that 21 self-operated colleges were responsible for more than half of the $57 million spent on local food in the region over that fiscal year, and the 67 colleges run by FSMCs accounted for 45 percent of that total.
Within the contracted campuses, there is also considerable variation; further farm to college research shows us there are campuses in New England that are both leaders in local procurement and also managed by FSMCs. Examples of those universities include the University of Vermont (operated by Sodexo: 22 percent local procurement in the 2015-16 school year), Roger Williams College (operated by Bon Appètit: 24.5 percent of total budget spent on local food between July 1, 2015 and June 30, 2016), and Green Mountain College (operated by Chartwells: 31.7% of the food purchased for the dining hall was local and community-based and/or third-party verified to be ecologically sound, fair, and/or humane percent in 2015). Some campuses, like those in the University of Maine (UMaine) System, are using their FSMC contracting process to increase the amount of local food they purchase. In their 2015-16 food service request for proposal, the UMaine System included a commitment to purchasing 20 percent local by 2020, causing competing vendors to submit proposals that reflected how they would help reach this goal. Sodexo ultimately won the bid and began working with the UMaine System in 2016. In their first year, they organized an advisory group, set local food priorities and procurement targets, branded a local foods program and hired a coordinator.
One operational characteristic that did not influence the percent of total budget spent on local food in the college sector was the size of the total budget itself. A correlation analysis based on survey responses showed no association between the size of the food budget and the amount of local food procurement (see Figure 3).

Figure 3: Size of college food budget and local food purchases. Note that 16 colleges did not provide their total food budget or the percentage of food purchases made up by local sources.
As shown, surveyed colleges across the budget spectrum are spending a very similar percentage of their overall budgets on local food, though logically colleges with larger budgets contribute to the majority of the overall local purchases. This is not necessarily the case in the K-12 sector, where funds allocated to food purchases are more limited and federal guidelines play an important part in shaping procurement practices. While the USDA Farm to School Census does not look directly at the relationship between total budget and local procurement, the survey does ask respondents to list the barriers they face in purchasing local food. “Higher prices” was the second most frequently mentioned barrier for K-12 respondents in New England (after “hard to find year-round availability of key items). This type of analysis has not yet been done for the most recent health care data.
Economic Impact of Local Food
Having this data is important for a number of reasons, one of which is being able to assess the economic impact of local food purchases. Research dedicated to measuring the impact of local food systems and institutional procurement is growing and much of it shows that these purchases have substantial effects on local economies. Estimating economic impact is both an art and a science. We will be delving deeper into this subject in a separate blog post.
Setting Procurement Goals
This data is also important as institutions work to set procurement goals and track their growth. In our second edition of Measuring Up, we looked at how institutions are using tools like the Association for the Advancement of Sustainability in Higher Education’s (AASHE) Sustainability Tracking, Assessment & Rating System (STARS) or the Real Food Challenge (RFC) Calculator to define “local.” In New England, standards set by the Real Food Challenge are also commonly used to set goals for local procurement. RFC’s Real Food Campus Commitment asks colleges and universities to commit to at least 20 percent real food by 2020 with the goal of shifting $1 billion annually of institutional food budgets towards real food across the country, effectively tipping the scale towards a new norm (RFC considers “real” food to be local/community-based, fair, ecologically sound and humane food sources).
“We chose 20% as a goal that was both ambitious and realistic for campuses,” says Hannah Weinronk, program coordinator at Real Food Challenge. “We designed this campaign to push the bar. There is a certain percentage of real food that schools are already purchasing or can get to with easy and simple shifts. There is another level of change that requires more energy and time, but has a higher impact.” Hannah says that most campuses across the country are between one percent and ten percent real food when they get started, with even the champion campuses having to make significant changes to reach 20 percent real food [4]. This shift requires working with vendors, building up local supply, and establishing supply chain relationships. “We want to see universities investing in new regional infrastructure and allowing local, sustainable farms and food businesses to expand,” says Hannah.
While these resources are geared toward colleges with dining services, RFC aligns itself with other organizations across the institutional sector; 20 percent is often used as a percentage goal for hospitals as well. Farm to school programs that take place in K-12 school settings, however, are less likely to have common standards. While federal child nutrition programs have uniform regulations that school districts must follow, farm to school goals around local procurement can look very different state to state and district to district. “ We are careful about not imposing federal standards on what farm to school looks like,” says Danielle Fleury, USDA Farm to School Regional Lead for the Northeast. “We do collect the information about where a school district currently is, through our Census, and we are always encouraging more. Wherever you are, there is always room for growth. We are supportive of wherever a school district is and wherever is feasible for them to get to.”
Campus FoodShift
In order to further support farm to institution efforts in New England, FINE has launched Campus FoodShift, an initiative dedicated to working one-on-one with New England college and university campuses. Participating campuses will receive targeted assistance from FINE and our partners designed to help them:
- Increase the amount of local food they procure
- Build informed and active campus communities committed to strong local food programs
- Participate in a vibrant, region-wide cohort of other campuses committed to building strong local food programs.
We will be piloting the program this year with two campuses; the first campus is Colby-Sawyer in New Hampshire and the selection of the second is still pending. This pilot phase will allow us to more fully develop the program for phase two, which will launch in Spring 2018. Schools that go through the program will join a FoodShift cohort where ongoing information and best practices can be shared. By working closely with a few campuses at a time, we hope to help shift a critical mass of campuses toward purchasing local and supporting the New England food system.
Footnotes
[1] FINE staff recently uncovered a likely decimal point error in USDA Farm to School Census data for the state of Connecticut. We are in communication with USDA and Connecticut school staff to confirm correct data. In the interim, we have updated our data to reflect our understanding of the error. For more information contact Hannah Leighton, Research Associate, at hannahr@farmtoinst.org [2] Data from the 2017 Health Care Without Harm Survey has not yet been published [3] For the purposes of this blog post, the term budget refers to an institution’s expenditures on food and beverage [4] There are of course exceptions to this. In 2017, The University of Vermont reached their 20% goal three years early and made a new pledge to reach 25% by 2020Coming Up Next
New England currently produces about 12 percent of the food consumed in these six states, according to research done by Food Solutions New England. In our next installment of Measuring Up, we will look at the products that institutions say are the most difficult to source locally, those that are the most readily available and the various barriers they face in accessing those local products.
Measuring Up is a six-part blog series designed to provide an introduction to the importance of data in understanding the farm to institution landscape in New England. The information shared through this blog reflects the respondents who voluntarily participated, and not the entire New England population; survey and census data are self-reported and may conflict with other data sources.
Hannah Leighton is a Research Associate with Farm to Institution New England working with the metrics team.


