This installment was originally posted on the Farm to Institution New England (FINE) blog.
INSTALLMENT NO. 5 of 6
Over the past several weeks, this blog series has presented data on the K-12, college, and hospital sectors in New England and has provided information on shared language, operational characteristics, and purchasing trends as they affect farm to institution activity. Understanding the behaviors and challenges of these purchasers on the demand side of the value chain is an important part of supporting farm to institution efforts in New England. However, in order to fully understand the farm to institution landscape in the region, it is essential to look at how other key players along the supply chain are affected by and affecting these efforts as well, most especially the farmers themselves.
There are 34,877 farms in New England, according to the 2012 USDA Census of Agriculture. The census and the USDA’s 2016 Local Food Marketing Practices Survey are the two most developed sources for producer-related data in New England. However, there is limited available data regarding the relationship between producers and institutions in the region. In 2016, FINE set out to better understand this relationship through our Producer Perspectives Survey. Two key goals of the survey were to measure the impact of farm to institution sales on agricultural producers and to understand the key barriers and opportunities for increasing farm to institution sales in the region. This installment of Measuring Up is dedicated to exploring the results of that survey.
Because there is no affordable and easily obtainable public dataset of producers in New England, this survey relied on social networks to reach the broadest possible sample and ultimately received responses from 223 producers across the six New England states. Of the respondents, 26 percent were already selling direct to institutions and 45 percent were interested in selling to institutions. The survey asked questions about their operational characteristics, products sold, types of institutions they sold to, and their perceived benefits and barriers of working with those institutions.
Operational Characteristics and Products Sold
Representatives from small, medium and large farms responded to the survey. Farms that sold to institutions expanded an average of three acres from 2012 to 2015 while those that did not sell to institutions remained the same size. Also, farms that sold direct to institutions had higher gross sales than those that did not. Farms with gross sales of $50,000 and higher were more likely to sell direct-to-institution, while farms with gross sales below $49,999 were less likely to sell direct-to-institution (see Figure 1).
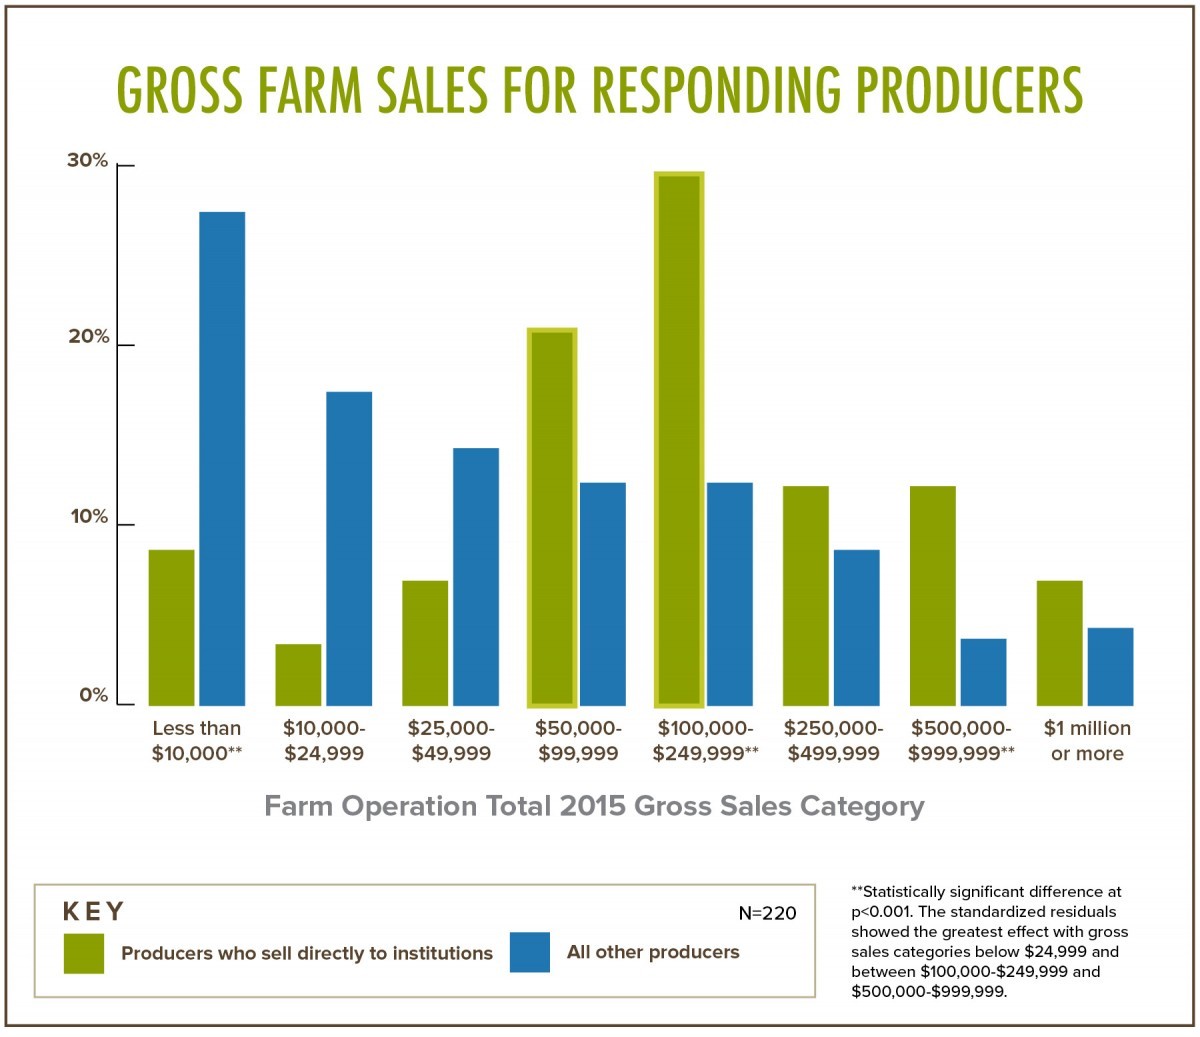
Figure 1: Respondents’ Farm Operation Total 2015 Gross Sales. Farms that sold to institutions generally had higher gross sales than those that did not.
On average, more than half of respondents’ gross sales came from either fresh fruits or vegetables. Producers were asked to list the top products, by value, that they sold to institutions to which the top five responses were tomatoes, apples, meat, potatoes, and carrots. While the produce listed aligns with the top items listed by K-12 schools and colleges, the mention of meat offers an interesting twist. If producers are referencing meat as one of the top-grossing items that they sell to institutions and institutions are listing meat as a product they have difficulty sourcing, it is likely that the price of meat accounts for it being a high grossing item for farmers, and not necessarily the volume being sold to institutions.
Types of Institutions
Farms that sold to institutions reported an increase in purchasing from those institutions over the last three years. Nearly 50 percent of institutional sales are currently going to K-12 schools (See Figure 2). Forty-two percent of producers selling direct-to-institution reported entering into informal preseason arrangements with institutions, and 16.4 percent reported having entered into formal preseason arrangements.
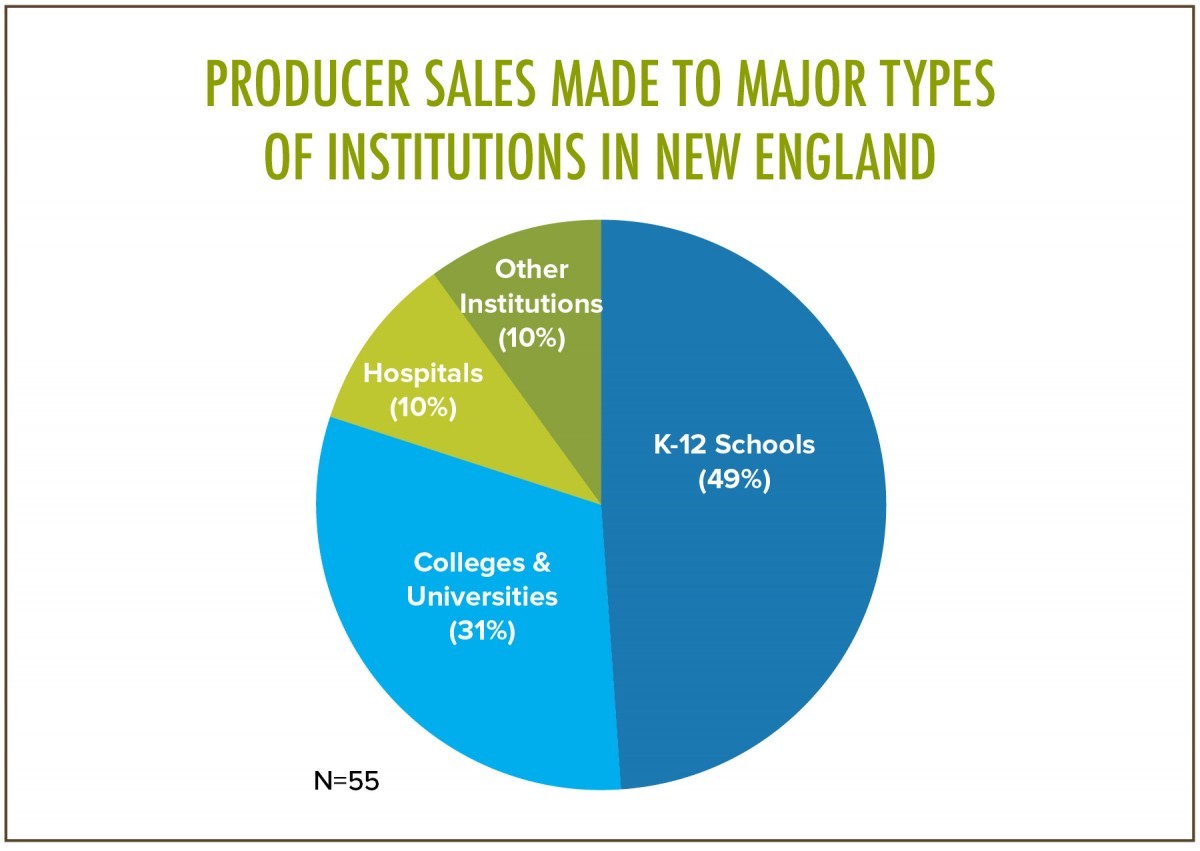
Figure 2: Average Percent of Total Institutional Sales Made Directly to Type of Institution
While K-12 schools currently made up almost half of institutional sales, producers responded that they were most interested in increasing sales to the college and university sector; 63.6 percent of respondents said that they were either moderately or very interested in increasing sales to colleges and universities over the next five years.
Motivations and Barriers
Both producers who currently sell direct-to-institution and those who are not yet selling to institutions referenced additional markets and building relationships in the community as reasons for working with institutions. However, while 64.1 percent of those currently selling to institutions listed fair price as a reason for working with institutions, only 31.6 percent of those respondents who are interested in but do not currently sell to institutions listed fair price. A full list of the reasons producers cited for selling to institutions can be found in Figure 3.
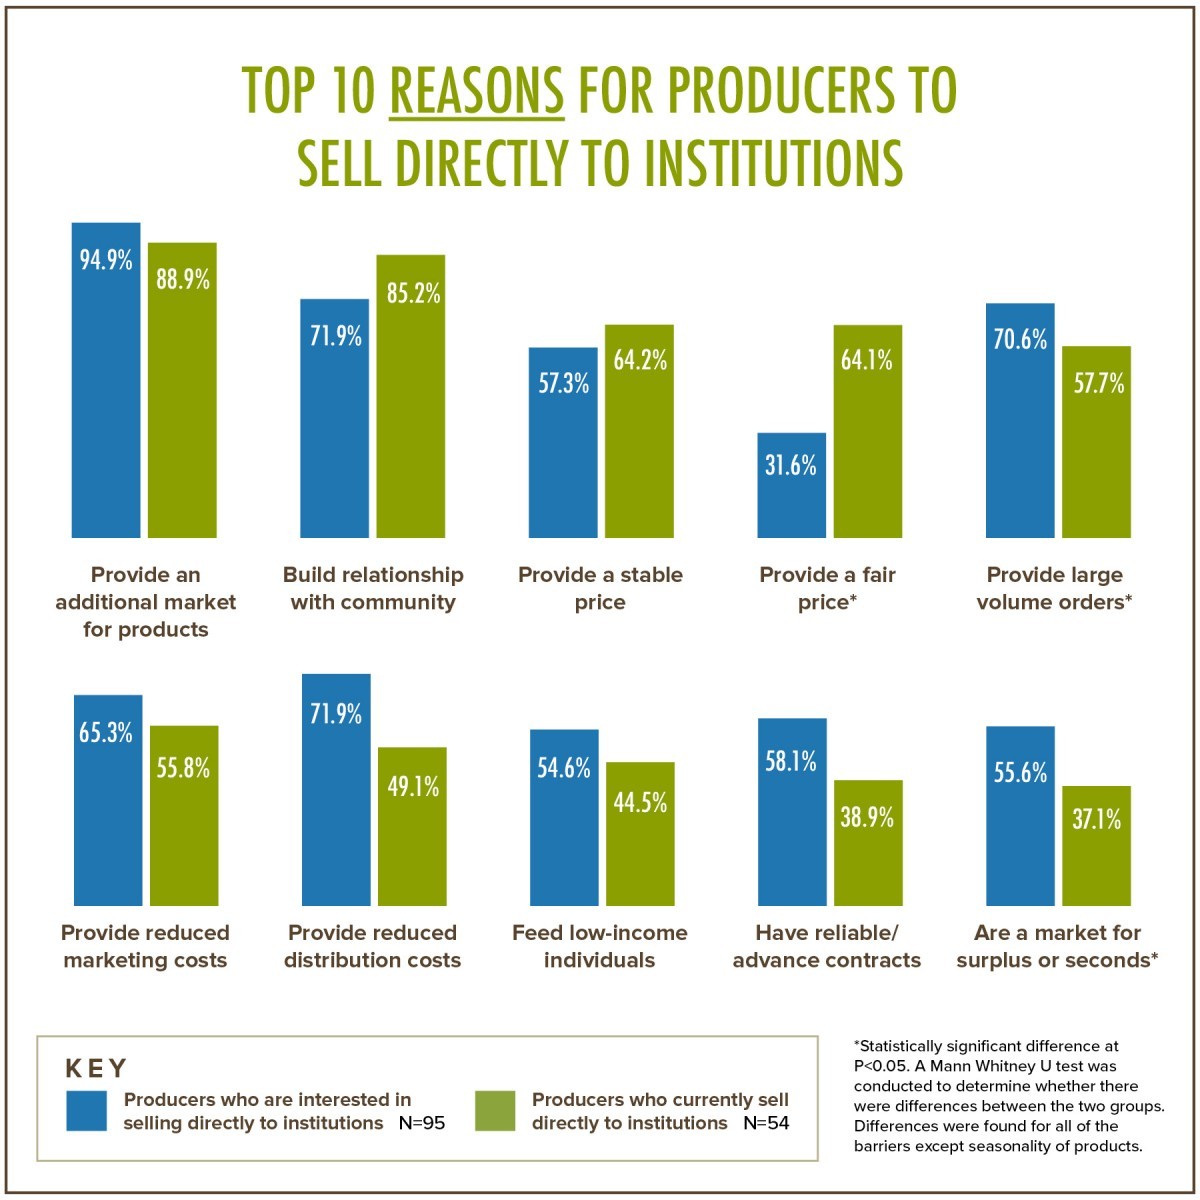
Figure 3: Reasons for Selling to Institutions From Responding Producers
Producers who currently sell to institutions and those who do not were also asked to list their perceived barriers for selling to these markets. The top barriers listed by producers currently selling directly to institutions were seasonality of their products, low interest in their products, and the low purchase price. Interestingly, those producers who were interested in but not currently selling to institutions considered potential barriers as more problematic than those who were currently selling direct to institutions (see Figure 4). Statistical differences were found between all but one barrier (seasonality), suggesting that selling direct to institutions may be easier than farmers expect it to be.
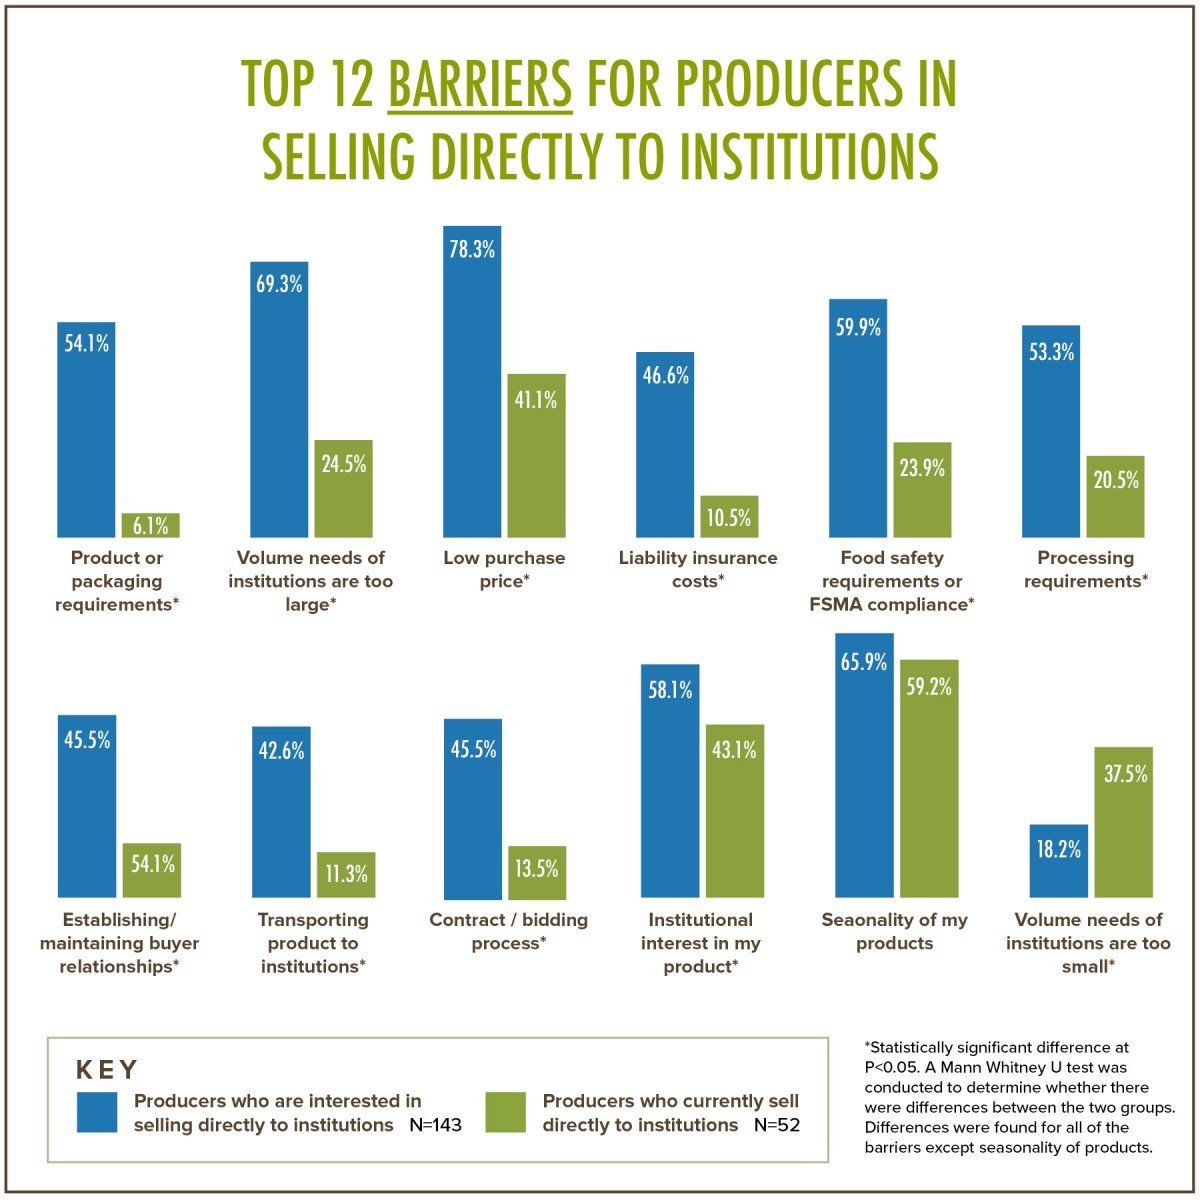 Figure 4: Barriers to Selling Direct to Institution from Responding Producers
Many of FINE’s recommendations involve facilitating direct connections between producers and institutional purchasers so that working relationships can be formed and the gap in perceived barriers can be minimized. Research shows that there is a place for nonprofits, government entities and other key players along the supply chain to provide technical assistance, wholesale readiness workshops and educational materials that will provide producers with the tools they need to continue to access these markets and get fresh foods into the region’s institutions. These recommendations and more will be looked at in more detail in the next and final installment of Measuring up.
Next Time
Next time, we will wrap up the series by taking a final look at how institutional purchasing power can be leveraged to make significant shifts in the regional food system. We will look more closely at what stakeholders along the supply chain consider to be the benefits of farm to institution markets, and we will delve deeper into the suite of recommendations that FINE and our partners have developed based on more than two years of metrics work.
Measuring Up is a six-part blog series designed to provide an introduction to the importance of data in understanding the farm to institution landscape in New England. The information shared through this blog reflects the respondents who voluntarily participated, and not the entire New England population; survey and census data are self-reported and may conflict with other data sources.
Hannah Leighton is a Research Associate with Farm to Institution New England working with the metrics team.


