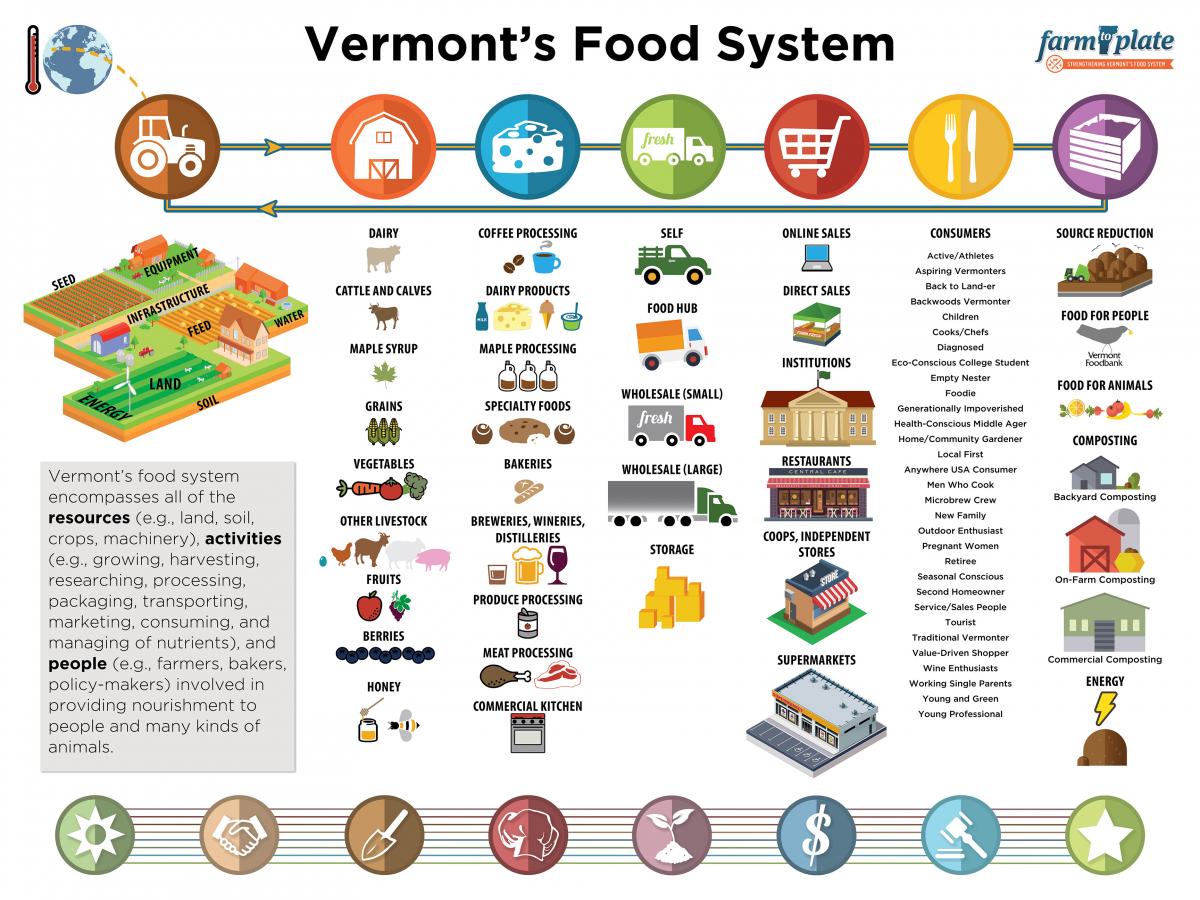
Data analysis and visualization is one of the powerful tools we can use to understand and explain trends in food systems. There are many clues to changes underway in food systems, from anecdotes and stories that are relevant in our communities, to news analyses and documentaries that tackle big issues. Vermont’s Farm to Plate Initiative has spent a lot of time collecting and interpreting official statistics from federal and state sources because they are representative of entire populations (e.g., the U.S., New England, Vermont, Addison County). The statistical agencies of state and federal governments collect and process large amounts of data over many years, allowing for year-to-year analyses. Some of the official statistics we use the most are:
- USDA Census of Agriculture for big picture trends in agricultural production, land use, income, and expenses.
- USDA National Agricultural Statistics Service for state-level animal and crop production data
- USDA Economic Research Service for many topics, including wages and food security data.
- U.S. Bureau of Labor Statistics for employment, establishment, and earnings data.
- Bureau of Labor Statistics, Occupational Employment Statistics for wage levels for specific occupation classifications.
- Bureau of Labor Statistics, Consumer Expenditure Survey for food expenditures by different categories, including race and region.
We use these types of official statistics as population indicators for the 25 goals of the Farm to Plate Strategic Plan, from food system jobs and establishments, to food production and nutrient management. As a general practice, we try to incorporate multiple population indicators for each goal to flesh out the analysis.
And because anyone with a National Geographic subscription has experienced the beauty and value of nicely designed infographics to convey information, we have really tried to make our data visualizations look cool. We invite you to explore the data visualizations we have developed for the Farm to Plate Goals.
Scott Sawyer is the Sustainability Analyst at Vermont Sustainable Jobs Fund, the backbone support organization for Vermont’s Farm to Plate Initiative.


