")
This installment was originally posted on the Farm to Institution New England (FINE) blog.
INSTALLMENT NO. 4 of 6
As interest in local food procurement increases at the institutional level, purchasers are reaching out to some of New England’s 35,000 farms to help supply them with local product [1]. According to data collected by FINE and our partners, institutions are buying a variety of items from these producers including apples, vegetables, beef, chicken, dairy, grain, and more. In this installment, we will look at two linked, but separate, data points. First we will explore the local products that New England institutions say are most readily available in the region and those that are more difficult to source. In the second half of the post, we will look at the barriers that college and K-12 respondents cite for local procurement in general. Because Health Care Without Harm does not ask about specific products or barriers in their Healthy Food in Health Care survey, this post will focus primarily on the college and K-12 sectors and will also include primary data around New England food distributors.
Top Locally Sourced Products
FINE’s 2015 Farm to College Dining Survey asked college and university respondents about the foods they purchase locally by value. Apples, milk and produce topped the list. Figure 1 shows the percentage of respondents who named each item in their top five locally purchased products.
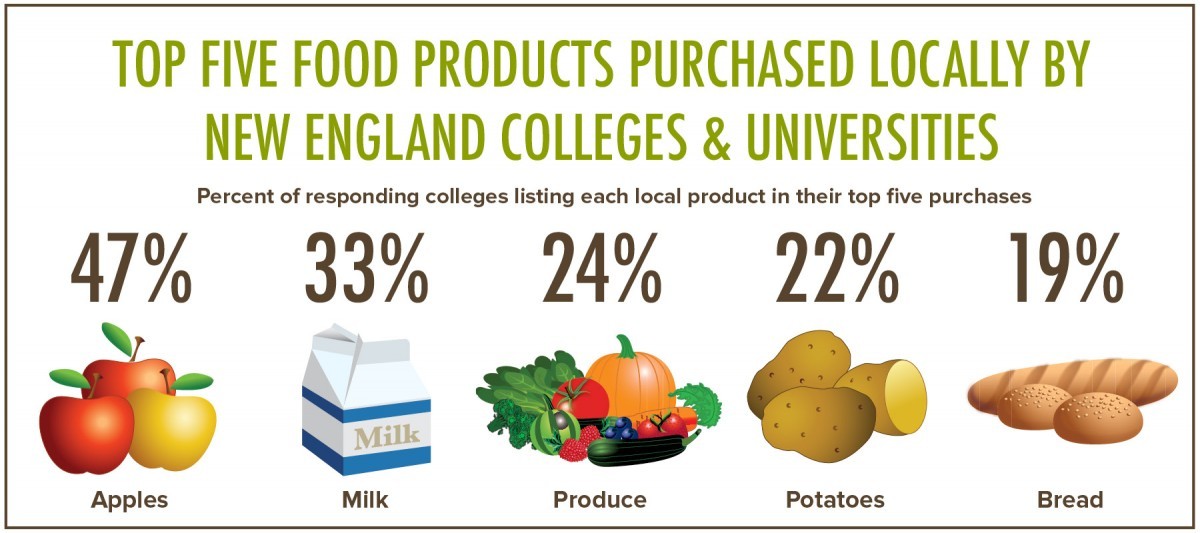 Figure 1: Top five locally purchased products listed by responding colleges and universities. n=100. Respondents were asked to be as specific as possible, however, the specificity of products listed by respondents varied. For instance, some colleges listed “produce” in their top five products, while others listed specific types of produce [2].
The USDA Farm to School Census asked a similar question of K-12 schools. Nearly all respondents in New England listed apples in their top five local products by value and about a quarter answered tomatoes, potatoes, lettuce and squash (Figure 2).
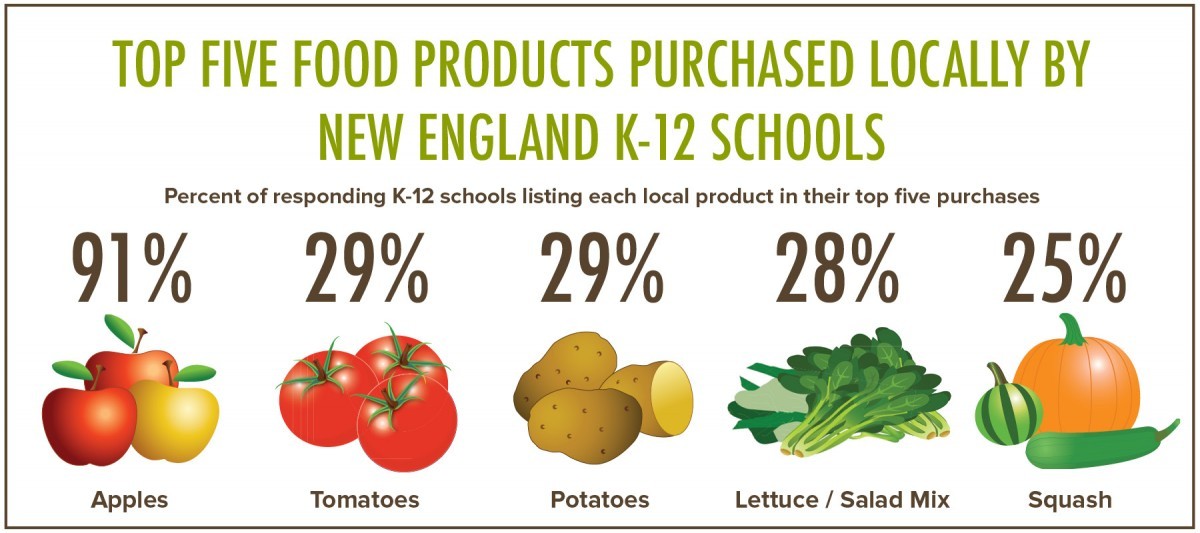 Figure 2: Top five locally purchased products listed by responding K-12 schools [3].
The fact that apples, potatoes, and various produce appear on both of these lists reflects, to some extent, the agricultural landscape of New England. The most cohesive documentation of the current New England Food System is Food Solutions New England’s New England Food Vision which shows that by acreage, New England grows about half of its consumed vegetables, about one-quarter of its fruit and over half of its dairy. These percentages are relatively high considering New England is currently only producing about 12% of the total food it consumes, according to the report. With these numbers in mind, it makes sense that milk, apples and produce appear as top local products procured by institutions who need to access these items in large quantities.
These numbers are also in line with the results of a 2015 Food Distributor Survey performed by FINE to assess the role of distributors and other intermediaries in farm to institution activity. Distributors serve as key connectors for New England institutions and producers; distributor respondents reported $1.12 billion in total sales in 2014, $366 million of which were institutional sales. These numbers represent a subset the region’s distributors, the total sales for the region are likely higher. Respondents were asked to list the top local products sold to institutions and the top three responses were apples, potatoes and beef. While beef is somewhat of an outlier on this list, It should be noted that distributors also listed meat as the top local product where institutional demand was greater than supply.
Products that are Difficult to Source Locally
FINE’s farm to college dining survey also asked respondents to rate their experience with sourcing different types of local product. Respondents reported that the most difficult products to source locally were poultry and meat. While there is more success procuring eggs, bakery goods and grains and seafood, respondents still face some difficulty in sourcing these products (see Figure 3).
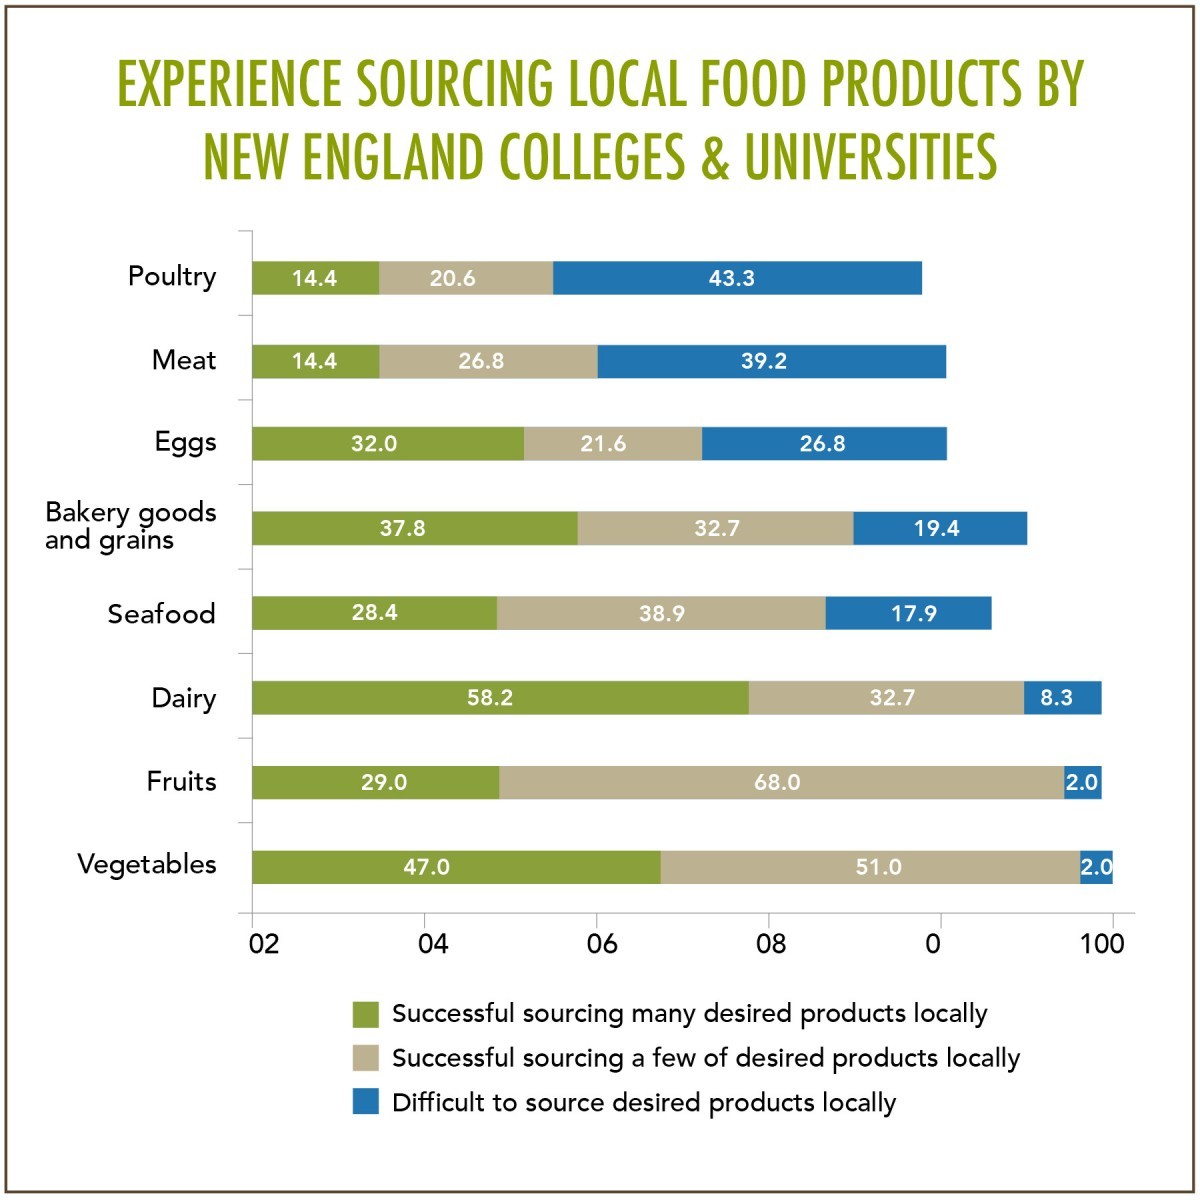 Figure 3: New England colleges and university respondents rank meat, poultry, and eggs as the most difficult local products to source, while vegetables, fruit, and dairy were more readily available. n=100.
Distributors were also asked to list the products for which there was a greater institutional demand than regional supply. While one-third of respondents reported that this was not a problem, the most frequently mention product where demand was greater than supply was meat, followed by salad greens and berries (see Figure 4).
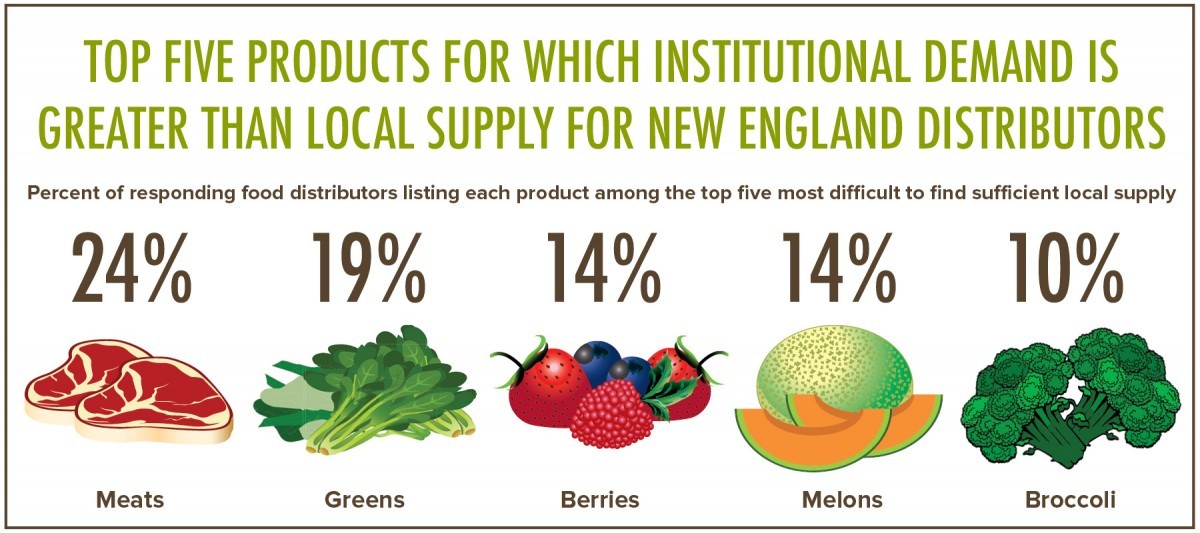 Figure 4: Top five products where institutional demand is greater than supply for surveyed New England distributors. n=21.
Once again, these responses reflect existing research. According to the New England Food Vision, only about 5% of beef consumed in New England and small amounts of poultry and pork are currently produced in the region. While New England fishermen produce almost as much product as New Englanders consume, high levels of importing and exporting make local fish procurement more difficult to measure. This research also shows that New England produces a very small portion of its cereals, beans, vegetable oils, sugar and beverage crops. We will look at the various barriers to procuring local food below, but it is important to note here that sheer regional capacity to produce certain products is a major obstacle in increasing local procurement rates for K-12 schools and colleges who often require a large and diverse selection of product.
Further Barriers to Buying Local
Respondents in the K-12 and college sector were asked to cite the barriers they face in procuring local food. While Health Care Without Harm’s survey does not ask health care respondents this same question, distributors who serve all three institutional sectors were asked to list their top barriers as well. College, K-12 and distributor respondents all reported that that on average, their top barrier was related to year-round availability or consistent supply of product; the second most listed barrier across the board was related to price; and the third varied with K-12 respondents citing sufficient volume from distributors and college respondents citing a lack of local items available from their primary vendor. Distributors cited food safety and other certifications as the third most common barrier (see Figures 5, 6 and 7).
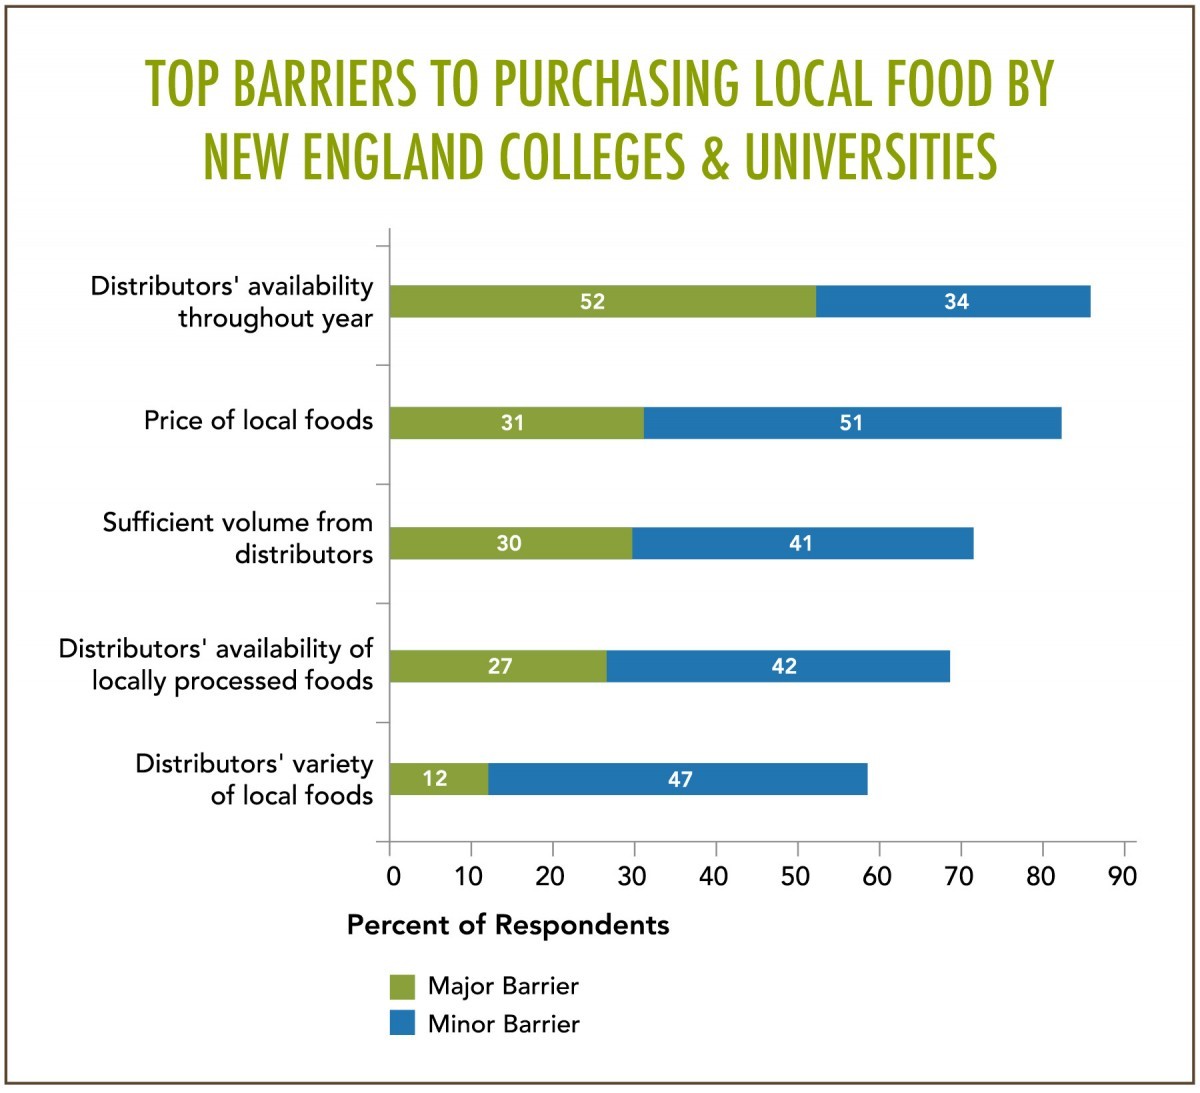 Figure 5: Top barriers to procuring local food for college and university respondents. n=100.
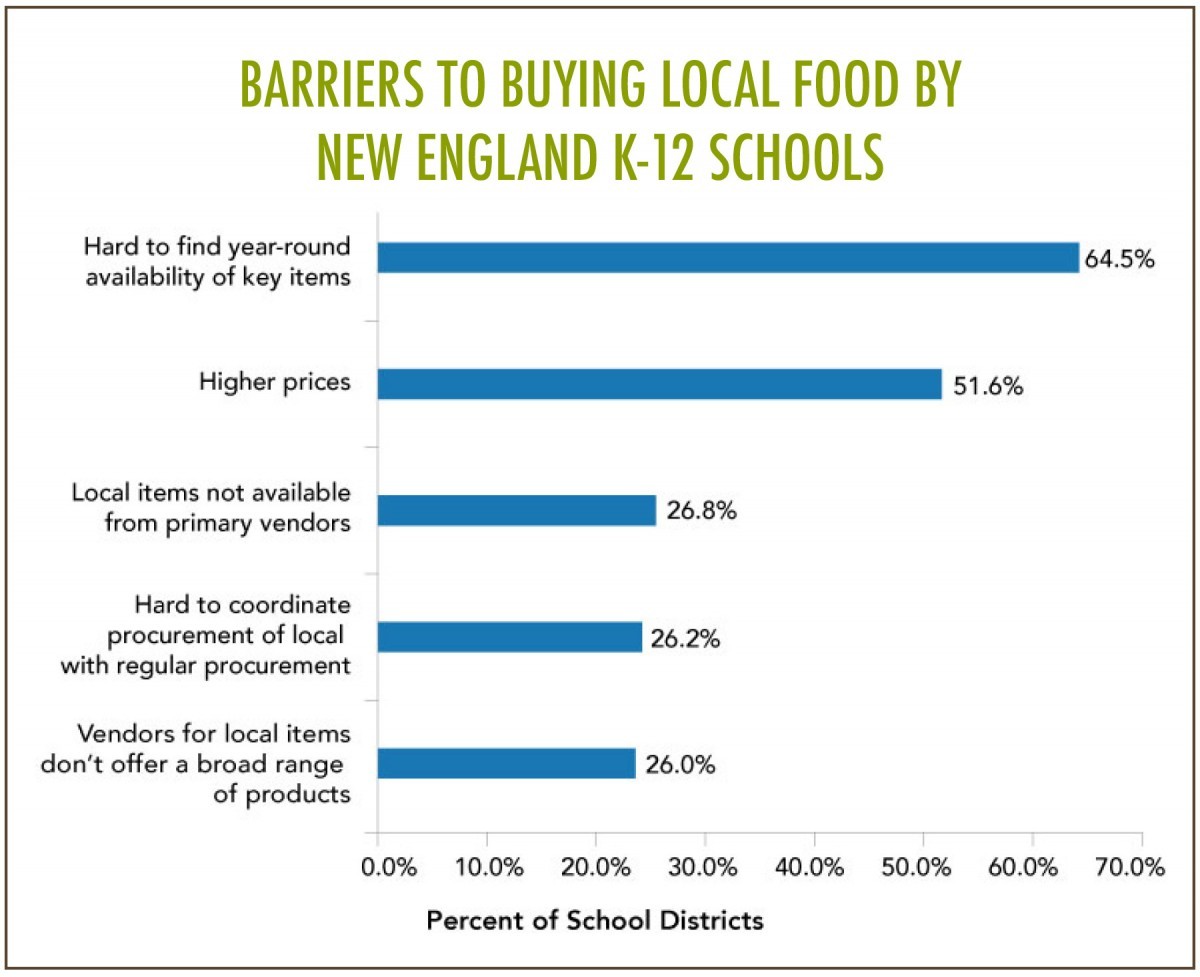 Figure 6: Top barriers to procuring local food for K-12 respondents [4].
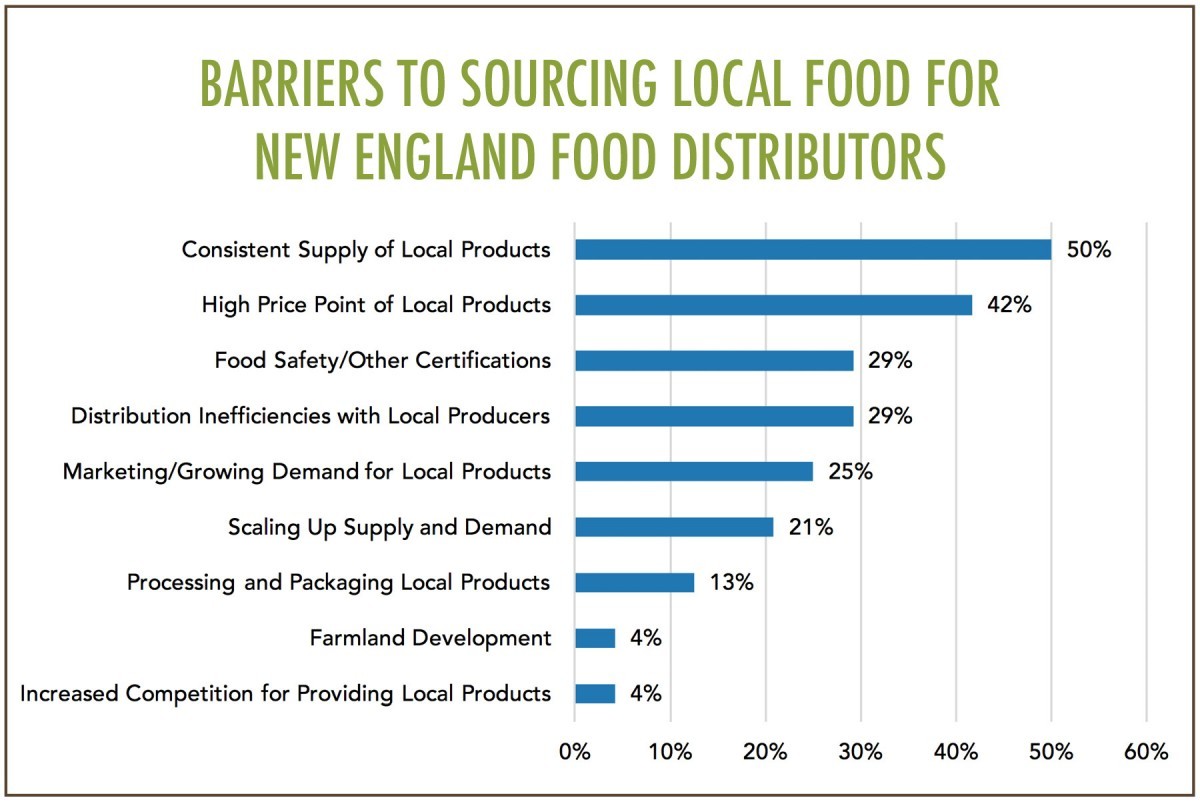 Figure 7: Top barriers to procuring local food for distributor respondents. n=24.
Each of these barriers could warrant its own blog post; the challenges faced by institutions in procuring local foods are complicated and intertwined and much of the work being done by FINE and its partners is designed to understand and mitigate those barriers so that purchasing local food at the institutional level is less of an exception and more of a norm. We also offer a suite of tools and resources that have been created by FINE and others across the region to address specific product needs. These include our case study series on getting local seafood into institutions and the USDA’s guide to local meat in child nutrition programs. In week 6, we will look more deeply at the recommendations and resources that have been informed by this work.
Footnotes
[1] Not all of these farms have the capacity or interest in working with institutions. There are certain operational characteristics that make a farm more likely to sell to institutions that we will look more closely at in week 5 of this series. [2] The milk supply chain looks quite different from the supply chain of other food products; milk supply chains are almost always regional regardless of whether or not they are marketed as such. [3] The “N” for top local products purchased by K-12 respondents is still be determined. It is likely a subset of the 541 school districts that reported farm to school activity in New England. [4] The “N” for top barriers to local procurement for K-12 respondents is still be determined. It is likely a subset of the 541 school districts that reported farm to school activity in New England.Next Week
There are nearly 35,000 farms in New England. As shown above, these producers are providing a variety of products to schools, colleges, and hospitals across the region. In the next installment of Measuring Up, we will look more deeply at how producers view institutional markets and what operational characteristics lead to increased institutional sales.
Measuring Up is a six-part blog series designed to provide an introduction to the importance of data in understanding the farm to institution landscape in New England. The information shared through this blog reflects the respondents who voluntarily participated, and not the entire New England population; survey and census data are self-reported and may conflict with other data sources.
Hannah Leighton is a Research Associate with Farm to Institution New England working with the metrics team.


